Shared Data Layer Architecture for Human and AI Consumers
One governed metrics layer keeps dashboards and agents agreeing.
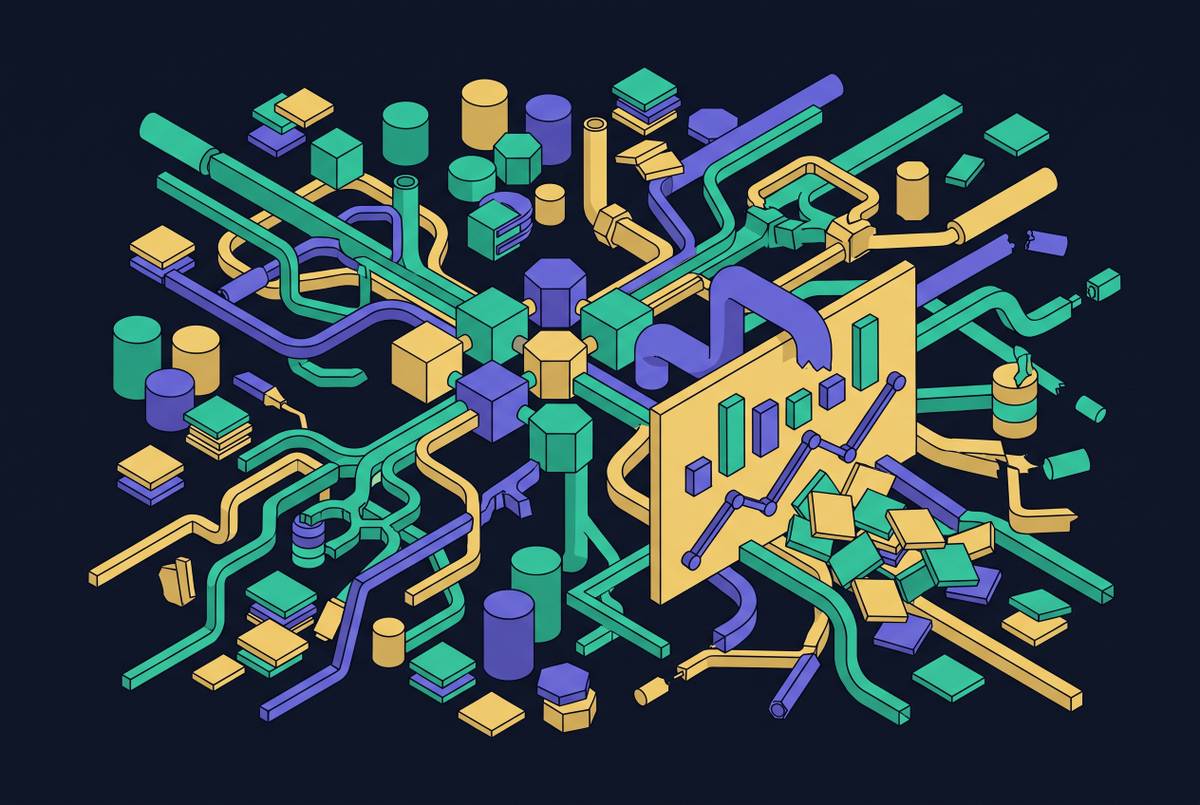
A founder opens three tabs, each a different vendor's dashboard, looking for last month's revenue, and gets three different totals. The subject of this piece is the shared data layer, and its argument is that this same failure, data a consumer cannot interpret in context, happens to AI agents too, only faster and with no one around to catch it.
The shared data layer for humans and agents
Neither a human analyst nor an AI agent can produce a reliable answer from data it cannot interpret in context. Nobody agreed in advance which number counts as revenue, so three systems each built a defensible version, and all three are sitting open on the same screen.
An agent hits the identical wall, except it doesn't know it hit one. The agent has no such instinct built in.
The consequence of that difference is speed and scale. They are not versioned pipelines that fail loudly and predictably, and they are not accountable humans who can be asked to explain a decision after the fact. They are something else, and that something else needs an interface built for it specifically, not inherited from either category.
The real test is whether dashboards already solve this for humans, making agents the only new problem. Adding agents to that same unresolved disagreement doesn't introduce a new failure. It scales an existing one.
What a governed, pre-modeled dataset means
A semantic layer is the place in a data stack where a metric means one thing, full stop, and stays meaning that one thing regardless of which tool queries it, which dashboard displays it, or which employee is on the team that year. Without that layer, a company has connected its systems to each other. It has not built a single source of truth, because connection and agreement are not the same achievement.
Four qualities separate a dataset that earns that kind of trust from one that merely exists: accuracy, timeliness, consistency across every consumer that touches it, and a named owner accountable for what it says. Neither consumer benefits from a metric that's accurate in one tool and stale in another.
The mechanism that makes this possible is pre-calculation. A dashboard and an agent querying that same pre-modeled dataset get the same number, because there's no moment at which either one is free to interpret the underlying tables differently. That's the entire difference between a governed dataset and a live query: one fixes the answer once, the other invites a new answer every time someone asks.
A popular shortcut hits its limits here. The Model Context Protocol, MCP, gives an agent a standard way to reach data and take action, but it says nothing about whether that data is correct. An agent connected by MCP straight into uncertified production tables will still produce confident, fluent, wrong answers, because MCP moves access, not meaning. A semantic layer is what makes an MCP connection trustworthy. Skipping it, and wiring an agent straight to raw tables because the protocol made the connection easy, is the most common architectural mistake teams make when they start giving agents real data access.
Parquet datasets queried through DuckDB illustrate the pattern well, without being the whole story. The format is an implementation detail. The property that matters is that the dataset was shaped and governed before anyone, human or agent, asked it a question.
Reaching the limits of querying production for analytics
The single most common mistake on a Supabase stack is running analytical queries straight against the production Postgres primary, and putting an agent on that same primary makes the mistake worse in ways a read replica alone doesn't fix. The habit is understandable: the data is right there, the connection already exists, and for a while, it works.
Supabase auto-generates a REST API directly from the Postgres schema the moment a table exists. For a human-facing app, that's already a real production risk. Once agents start querying through that same API, the risk compounds, because an agent doesn't know which tables were meant to be public and which were simply never locked down.
There's a structural mismatch underneath this too. The production primary is row-oriented, tuned to handle fast transactional reads and writes, the kind of work an application does thousands of times a second. Analytical queries ask something different of a database: scan wide sets of rows, aggregate across them, summarize. Running that kind of query against the primary makes it compete directly with live application traffic for the same CPU and memory that's supposed to be serving customers.
Connections make the problem concrete. Connection pooling stops being optional once traffic reaches that scale. Connection pooling becomes a requirement for the database to stay up.
The fix is architectural separation: replicate Postgres into a columnar, analytical store, define each metric once on top of that store, and point dashboards, agents, and APIs at that governed layer rather than at the primary or at some unmanaged replica nobody is watching. Supabase does give teams roughly two hundred metrics covering CPU, IO, WAL activity, connection counts, and query statistics, compatible with a common monitoring standard, and that visibility is genuinely useful for keeping the database healthy. It tells a team when something's wrong with the primary. It does not tell them whether the number an agent just used in a report matches the number on the board deck, because operational monitoring and governed analytics are answering two different questions.
The architecture of a shared layer that serves dashboards and agents from one governed surface
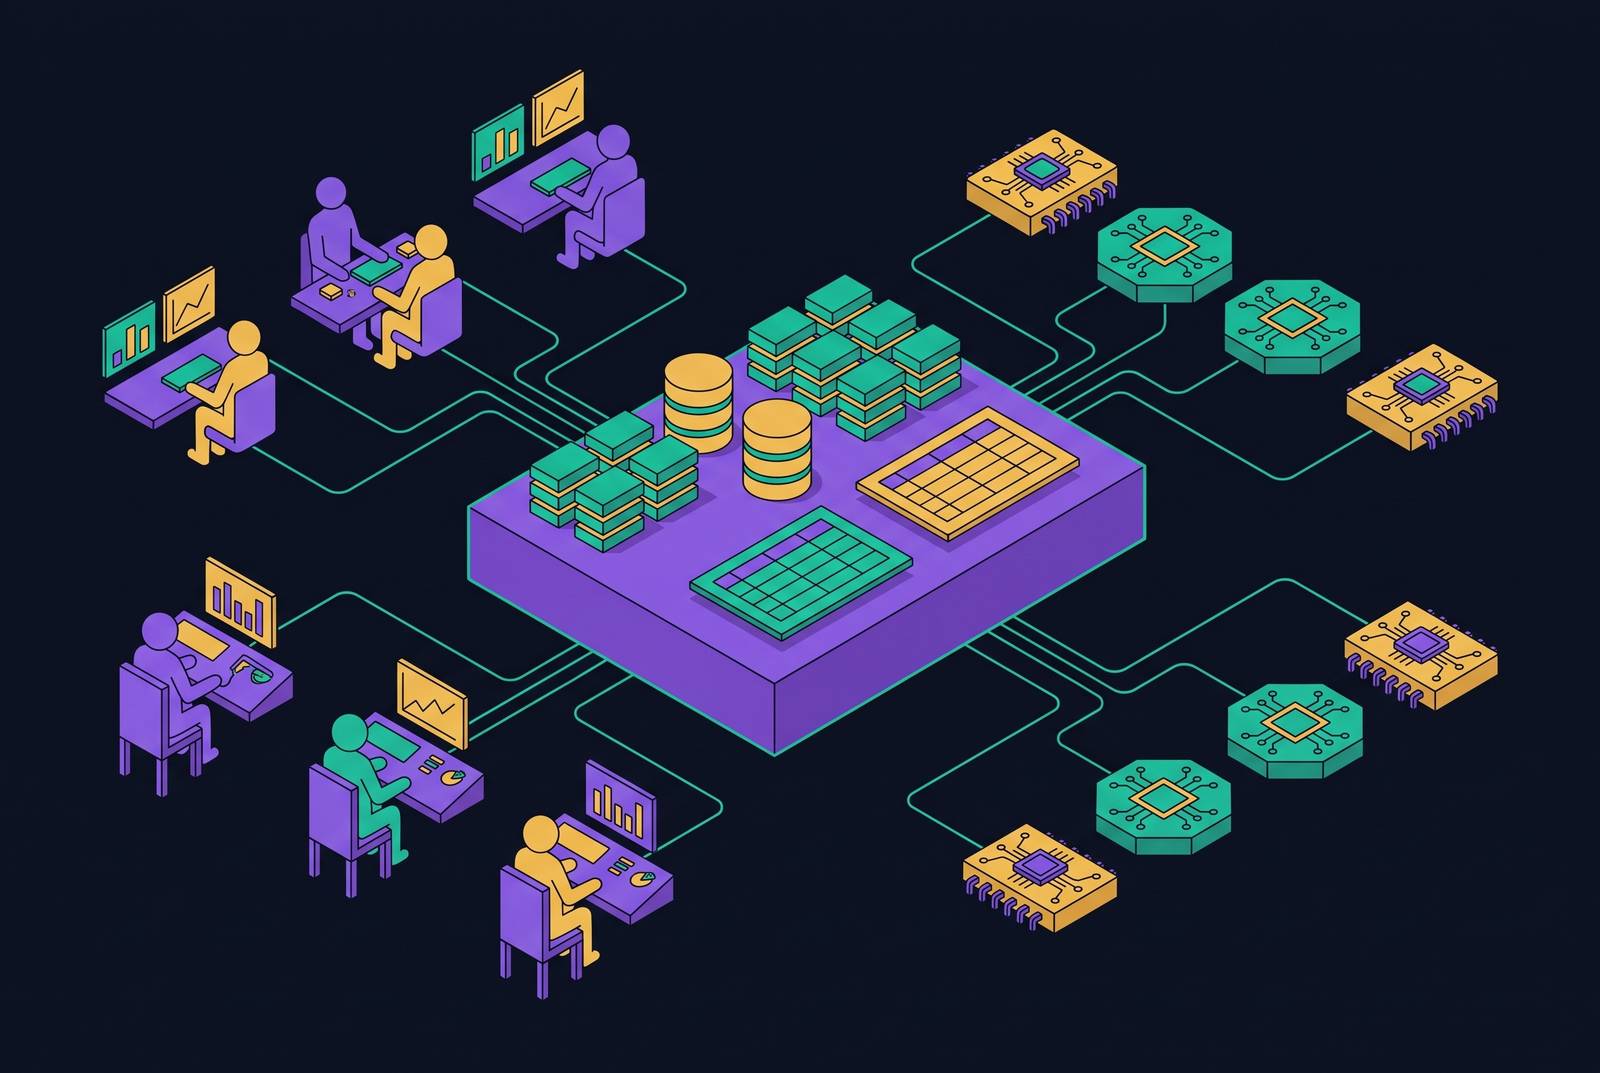
A shared data layer serves both humans and agents not by giving each one its own copy of the data, but by exposing the same governed, pre-modeled datasets through whatever interface each consumer actually needs, a dashboard on one side, an MCP server or API on the other. Only the surface changes.
Three components have to work together to make that possible. Agentic access needs to move faster than that, not slower.
The second is the semantic layer itself, the place where MRR, churn, CAC, and pipeline each mean exactly one thing. That definition is the artifact both a dashboard cell and an agent's reasoning step draw from. Both pull the same pre-agreed number.
The third is a context layer, sometimes called an agentic control plane: table definitions, who owns each dataset, how fresh it is, and what access rules apply, all handed to the agent before it starts reasoning. This is the same thing an experienced analyst builds up informally over months on a team, the instinct for which numbers to trust and which tables are stale. A context layer makes that instinct explicit and machine-readable, so an agent doesn't have to earn it the slow way.
MCP is the standard that connects these pieces without forcing a single front end on top of them. Resources, in this scheme, are something a server exposes, not a fourth architectural role alongside the other three. This separation buys a team a headless analytics layer: the presentation surface, whatever renders the dashboard or runs the agent, is decoupled from the governed definitions sitting underneath it.
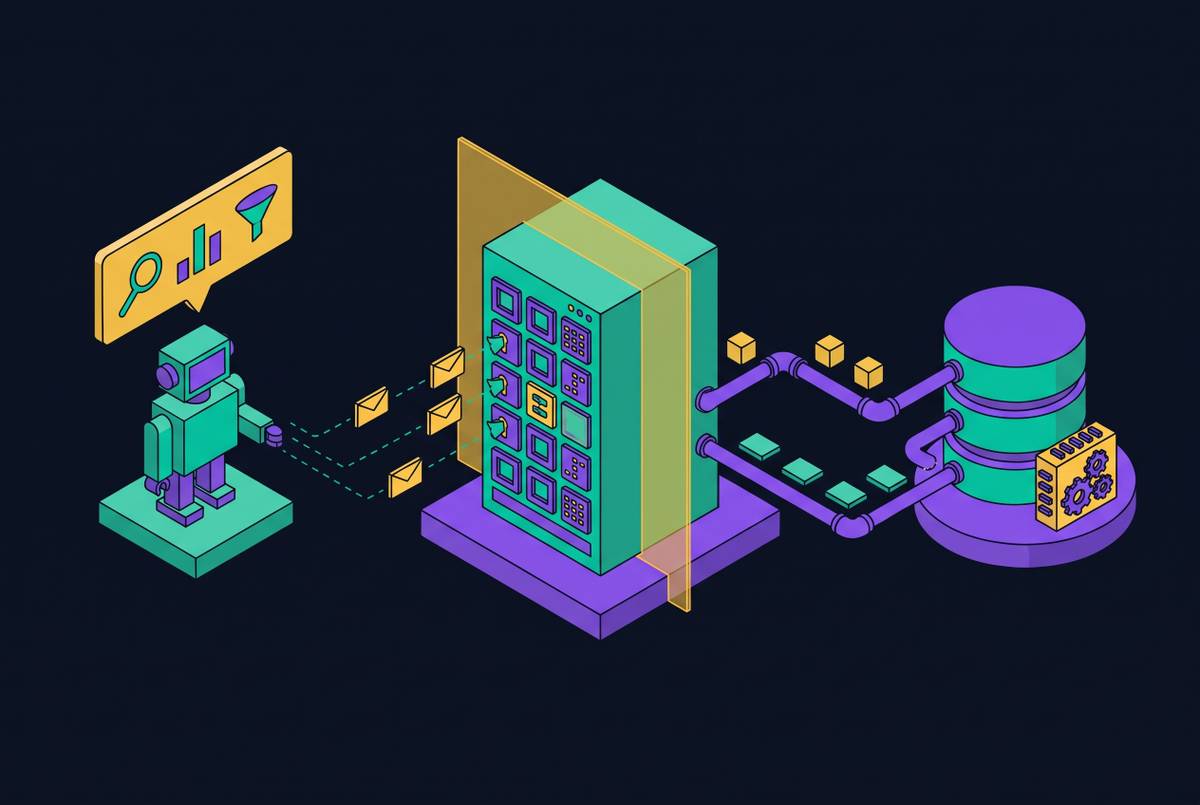
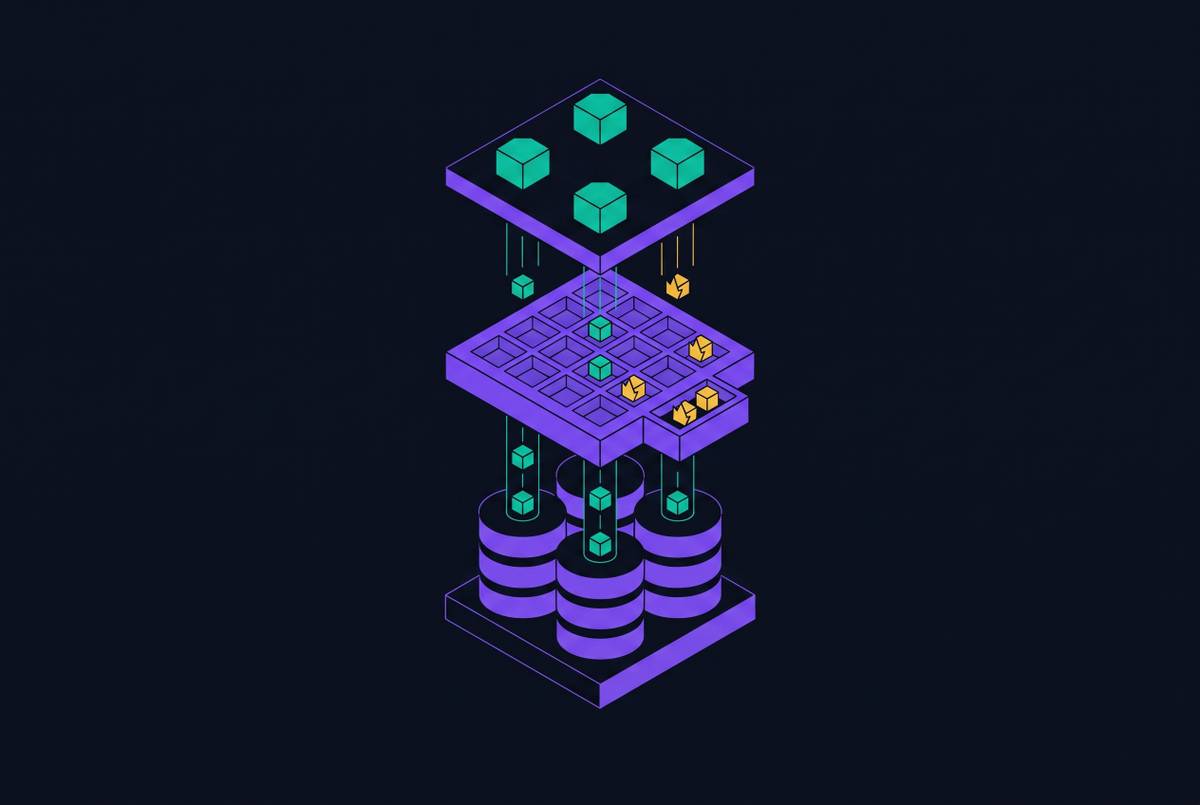
Dreambase implements this pattern directly. Metrics get pre-calculated into governed Parquet datasets, queryable through DuckDB, and exposed through a single MCP server. Agents never touch the production database. The structural result is headless analytics: infrastructure decoupled from any one front end, reachable over MCP or API, able to push the same governed number to a dashboard, a Slack message, an inbox digest, or an agent's reasoning context, all without maintaining a second definition anywhere.
Governance belongs inside the access layer
Traditional data governance assumed violations happen at human speed and that policies get read and followed by humans. Neither assumption holds for an agent, and that's why governance wrapped around a data layer from the outside, rather than built into the layer itself, can't catch what agents do wrong.
Four traits of agents explain why. And when agents call other agents in multi-step workflows, the resulting data flows can violate compliance requirements even when every individual agent stayed inside its own stated permissions, because the violation lives in the combination, not in any single step.
That last point explains a gap most organizations have: they can usually monitor what their agents are doing, but they can't stop an agent mid-action when something goes wrong. Monitoring after the fact is a detective control, built for catching human-speed violations during a quarterly audit. It was never built to intervene in real time, and agents don't give it the luxury of a quarter to notice.
Four access patterns answer this directly. And credentials need to be issued just-in-time: rather than embedding static, long-lived secrets in code, the agent gets treated as a workload identity in its own right, issued short-lived, scoped credentials at the moment it actually needs them.
The stakes behind these patterns are documented, not hypothetical. Five Eyes guidance published in May 2026 names the Confused Deputy pattern, a trusted agent manipulated into performing unauthorized actions while still operating under its own legitimate identity, as a key risk scenario within its privilege risk category, one of five categories the guidance defines. The NSA has separately noted that MCP's adoption has outpaced the development of its own security model.
Dreambase's governance design follows these patterns directly: agents query governed Parquet snapshots through MCP rather than reaching into production Postgres, so the blast radius of anything an agent does is bounded by what's inside that pre-modeled dataset, not by whatever its credentials happened to be able to reach.
Fragmentation from separate data paths for humans and agents
A dedicated data path for agents tends to start as a practical shortcut and end as a second source of truth, one where the same metric means something different depending on whether a human or an agent asked the question. The instinct that produces this outcome is reasonable on its face. It just doesn't hold up once the system is running in production.
The pattern tends to unfold the same way each time. In production, it's answering from a dataset that has already started to diverge from the dashboard the rest of the team still checks every morning.
This is the same mistake as trying to fix scattered data by centralizing everything into one warehouse, just aimed at a different consumer. And the problem compounds further once agents start calling other agents: a compliance reporting agent might ingest unmasked PII straight from a data quality agent's intermediate output, and the resulting data flow can violate compliance requirements even though neither agent individually stepped outside its own stated permissions.
The test for whether this has already happened is simple. If a human-facing dashboard and an agent's report disagree on last month's churn number, and the honest answer to "which one is right" is "we'd have to check," the team has rebuilt the three-tabs problem, just one layer deeper, at the infrastructure level instead of the browser level.
The harm was always about decisions getting made on stale or differently-defined data, delivered with the same fluent confidence an agent brings to a correct answer. Read-only access doesn't make a number accurate, it just makes it safer to be wrong quietly.
One definition of a metric, shared across every person and every agent that touches it, does more for a company than any single dashboard feature or any individual agent capability, because that one definition is the precondition for either one being trustworthy.
Building toward one governed layer without a data team
Building a single source of truth depends on decisions about what a metric means, who owns that definition, and how it gets calculated, decisions that have to be made once, written down, and settled before any consumer, human or agent, can act on the result with confidence.
That work starts with definition, not infrastructure. One person in engineering should own data as an explicit part of their job, not as a sliver of a data engineer's time split six ways. Without a named owner, metric definitions don't stay stable, they drift into silos, each team quietly adjusting its own version until nobody's number matches anyone else's.
Supabase handles a lot of day-to-day operational reporting well: active subscriptions, completed actions, support ticket volume, retention by cohort. None of that requires moving data anywhere. What it shouldn't do is double as the analytical surface for the business, because the production primary was never built to carry that load alongside live application traffic. The fix is the same one already laid out: replicate into a governed analytical layer and define each metric once on top of it.
Dreambase builds this pattern for Supabase teams specifically: it pre-calculates metrics into governed Parquet datasets, makes them queryable through DuckDB, and exposes all of it through a single MCP server, so agents never touch production Postgres while dashboards, reports, and agent contexts all draw from the same governed artifact. No ETL pipeline to maintain, no schema changes to the production database, no separate warehouse to stand up, no data team required to keep it running. For a founder-scale team, the payoff is a business where the people and the agents working on it are finally looking at the same numbers.