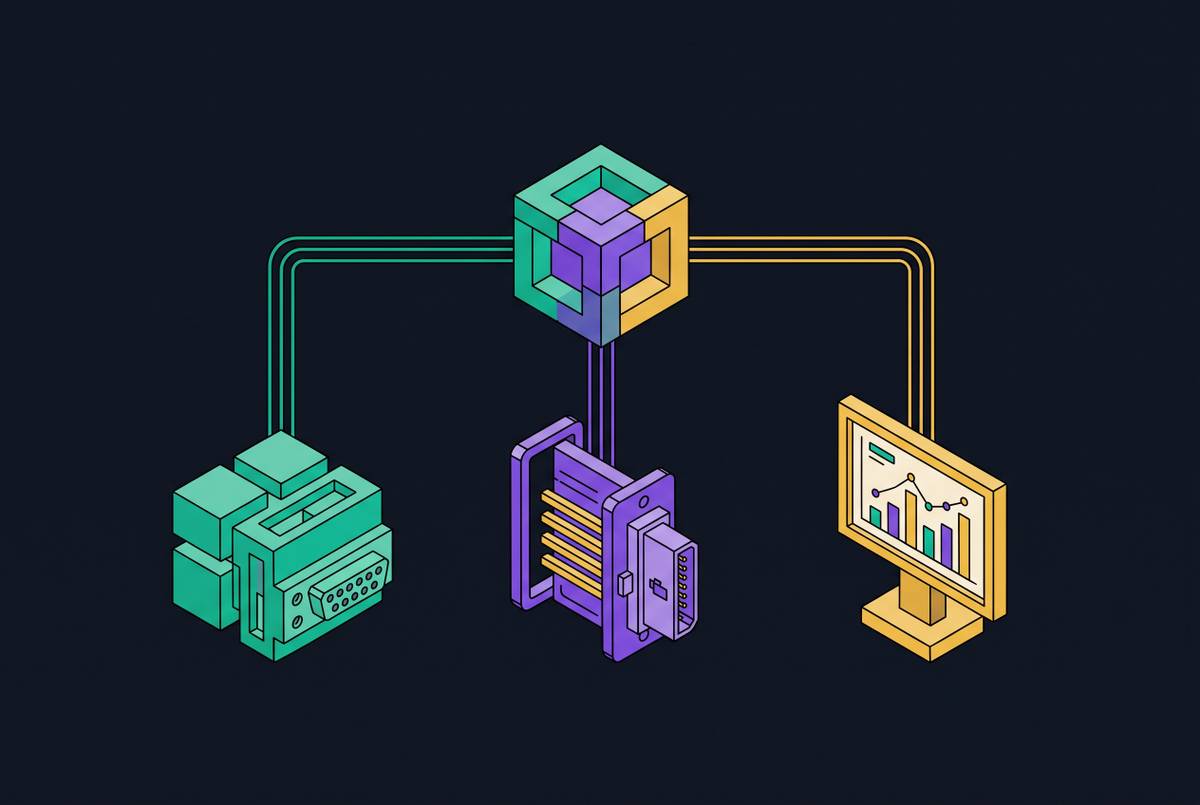
Instrumenting an AI Agent With Event Tracking and Query Endpoints Instead of a Dashboard
Agents need governed query tools and event logs, not charts.
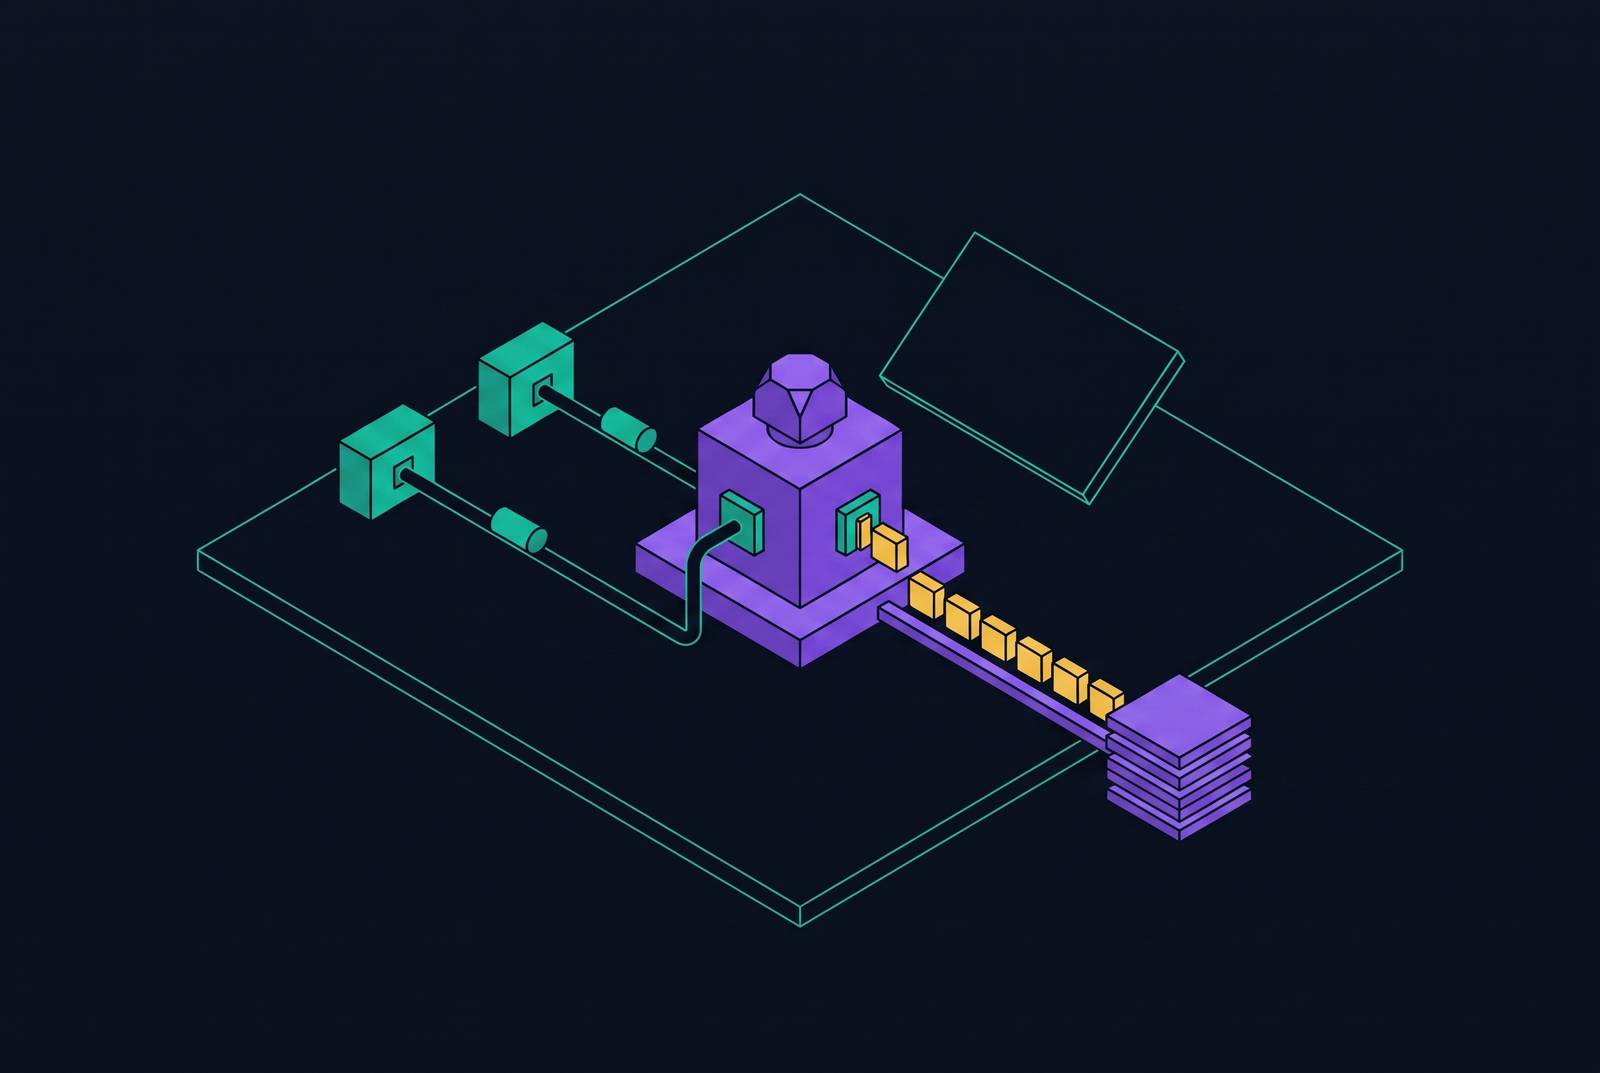
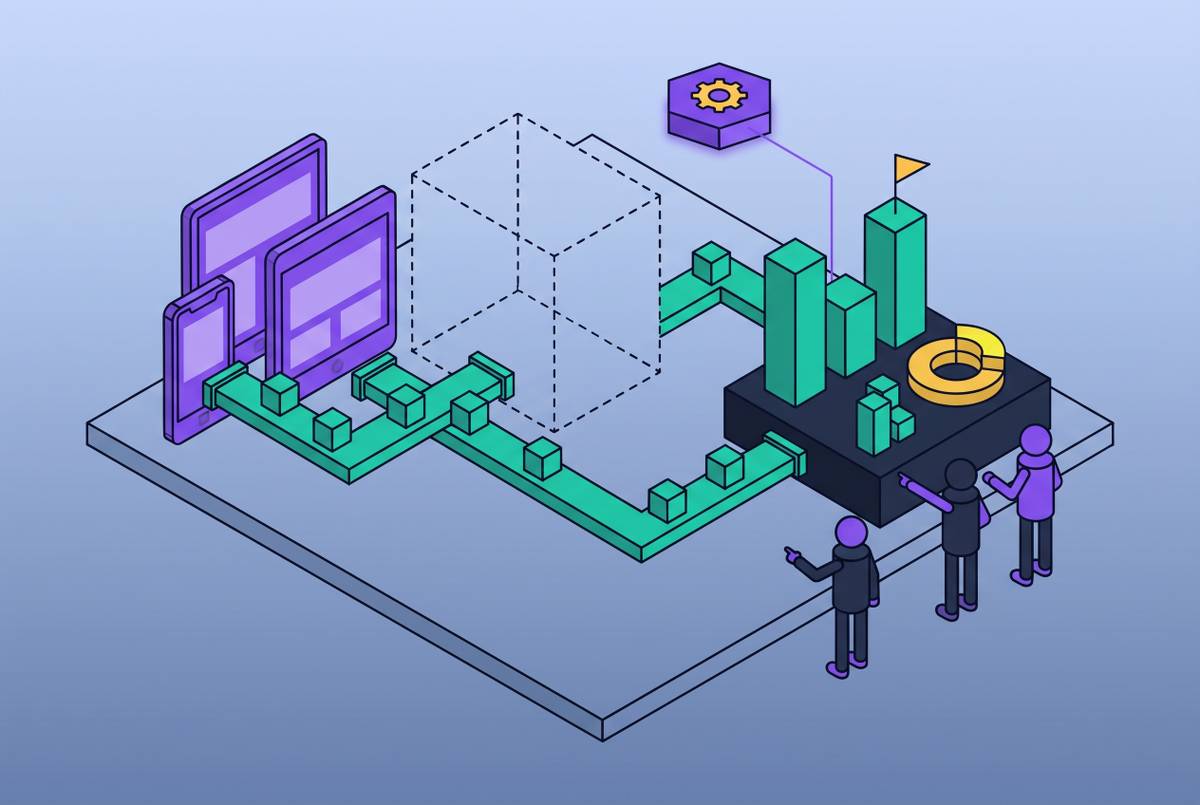
For API-first and agent-first teams, the right headless analytics backend separates structured event collection, pre-modeled analytical data, and governed query endpoints from any dashboard UI. Instrumenting an AI agent means recording its actions and giving it bounded, machine-readable context to act on. For teams building on Supabase, this pattern provides programmatic access without placing production in the agent’s analytical query path.
Why dashboards fail as instrumentation for AI agents
An agent cannot “look” at a dashboard the way a DevOps engineer reads a red or green light. A rendered chart’s visual cues depend on a person interpreting the display, while an agent needs machine-readable results it can use in its next decision. Even when a dashboard has a query API behind it, the visualization itself is not the instrument the agent needs.
The timing mismatch is just as fundamental. People use dashboards to get information when they need it, while agents keep running an observe-think-act loop. A financial agent working from stale positions may generate trades that are already invalid, and a support agent reading a cached order table may report a package as in transit after delivery. These decisions have an immediate effect on money and on what customers experience. A batch snapshot introduces a staleness gap in the data path that persists regardless of chart design.
What agents actually need from a data path
Freshness means that data reflects current reality. An agent that keeps making decisions needs context that is still useful when it acts. Queryability determines how easily it can get that context. It needs SQL or structured queries against pre-materialized results. Full table scans and slow analytical queries slow the decision loop even when the records are fresh.
Richness gives those results their business meaning. A balance alone does not tell an agent whether it is overdue, whether the customer is high-value, or whether a recent support ticket changes the context. Structured data and semantic retrieval serve different needs here. The data path must expose enough context for the agent to interpret a result, rather than leaving it to infer meaning from an isolated number.
Discoverability makes that context usable without guesswork. An agent must be able to find available data and understand its schema and meaning before requesting it. SQL COMMENT ON provides a lightweight way to make tables and views self-describing. At the access boundary, named tools and their descriptions make available queries understandable.
Structured event tracking as the foundation of agent instrumentation
The write side begins with records of what the agent did, what it decided, and what context informed the decision. Each tool call, parameter set, queried data source, decision, error, and step latency should become a structured event with a timestamp and agent-session identifier. A null pointer exception alone gives an agent or orchestrator little basis for self-correction, while structured fields and natural-language context can make the cause interpretable. This record of what ran helps people audit it and make it better.
For teams using Supabase, application events sit alongside the infrastructure signals they already have. Supabase’s Logs & Analytics feature, powered by Logflare, captures events from the API gateway, Postgres, Storage, Edge Functions, Auth, and Realtime. OpenTelemetry integration allows export to compatible observability tools, while the Metrics API exposes approximately 200 Postgres metrics compatible with monitoring systems, including connections, query time, and WAL. These signals describe the infrastructure supporting agent activity. They do not replace the agent’s own record of decisions and tool use.
The initial signals to instrument include active connections, average and slow query time, index hit rate, API response times, and error rates. These reveal pressure on the production system. To make execution traces useful beyond performance diagnosis, they also need a connection to the governed data the agent touched. Atlan connects tool calls and retrieval steps to governed assets, ownership records, and semantic definitions through its MCP server and sovereign context layer. The relevant principle is traceability from an action to the data context behind it.
Why agents must not query production directly, and what to use instead
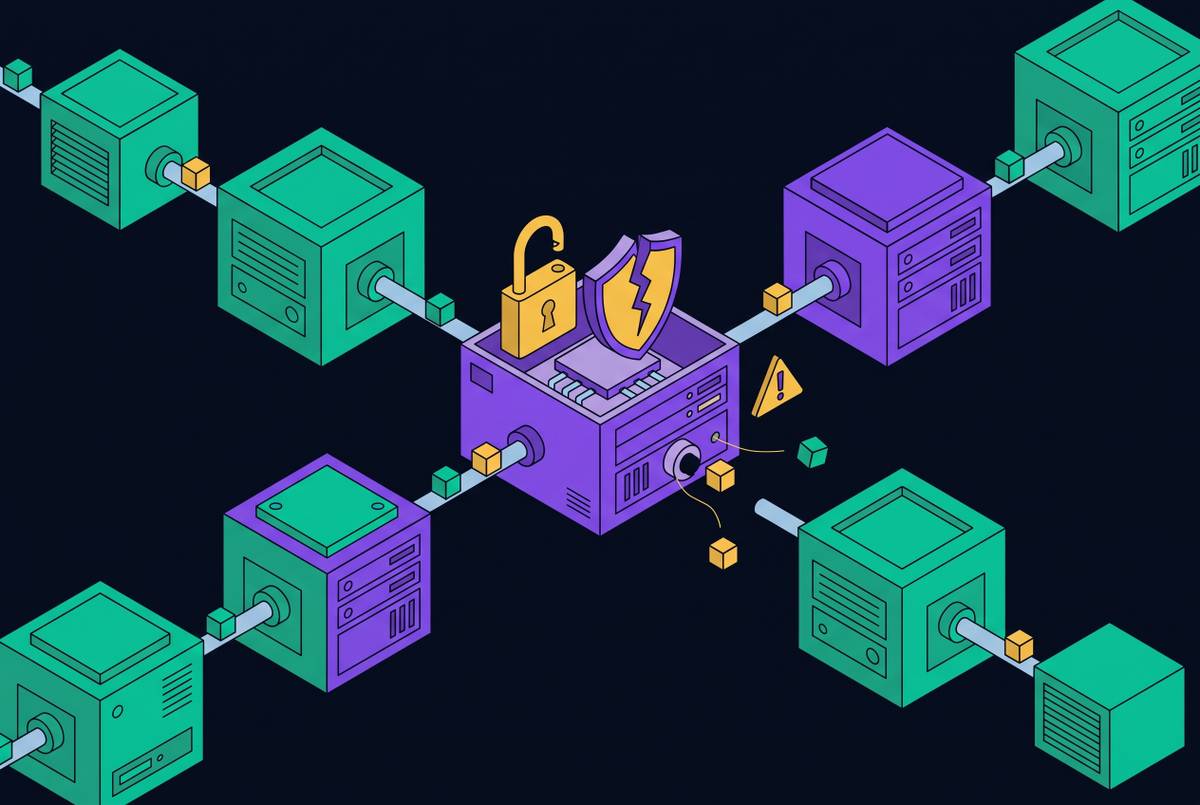
A production database connection string gives an agent too much scope to access data. Heavy analytical queries create I/O pressure on the same Supabase Postgres instance serving transactional requests, and Postgres’s row-oriented storage is not optimized for the aggregations agents typically run. A runaway query can also use up the capacity for connections. Direct access can bypass row-level security if the connection has more permissions than intended. Read-only access does not, by itself, prevent expensive or overbroad reads.
A function such as list_overdue_invoices(account_id, limit) narrows the operation to a fixed parameterized query under a read-only role. Row-level security remains the enforcement boundary at the Postgres layer, but its implementation also affects performance. Supabase’s official RLS performance guide shows that wrapping an auth call as a subquery changes how often Postgres evaluates it from once per row to once per statement. Statement timeouts provide another mandatory safeguard, aborting an unbounded join before it saturates the instance.
The security risk extends beyond query cost. The U.S. National Security Agency stated in a May 2026 report that MCP’s rapid proliferation had outpaced development of its security model. The MCP specification separately identifies “confused deputy” risks in proxy servers and forbids token passthrough. These constraints apply even when a tool only reads data. Tokens must be tightly scoped, credentials isolated per agent, and tool permissions no broader than the task requires.
Building governed query endpoints the agent can call as tools
The appropriate access unit is a named, parameterized query endpoint backed by a pre-modeled view. The agent calls the function, passes typed parameters, and gets a structured result set. A read-only role stops changes to the data, and row-level security at the Postgres layer limits which data the request can read.
Pre-materialized views are the analytical serving layer behind that boundary. They give the agent pre-calculated results so it can skip aggregating raw tables on each call. Useful shapes include a real-time user context view, a budget and spending view, an inventory view, and a behavioral signal view. Each serves a defined decision need. Their freshness still has to satisfy the agent’s operating loop, because pre-calculation alone does not make a result current.
Each endpoint then becomes a tool in the agent’s registry. Its name, description, and typed parameters let the agent discover and invoke it without generating SQL, inferring schemas, or inventing joins. Paragon defines tool calling as the way agents act in applications, and agents can use it to make governed data reads too. Authorization remains a separate requirement. Every endpoint needs OAuth or JWT middleware built on the hardened authorization specification using Client ID Metadata Documents, with each agent context sandboxed so that access cannot expand beyond its task.
How MCP turns query endpoints into a discoverable agent data layer
With MCP, separate query endpoints become a shared access layer that agents can find without a custom integration for each client. Its Tools are the query operations an agent invokes, while Resources provide governed datasets as context. Prompts supply reusable templates for framing data requests. These primitives give the interface a consistent vocabulary. They do not replace the authorization or query restrictions already required behind each endpoint.
The revision of the MCP specification on July 28, 2026 removed protocol-level sessions and the Mcp-Session-Id header. As a result, any MCP request can land on any server instance without sticky routing or a shared protocol session store. This supports horizontal deployment of the query layer. A headless setup uses a stateless server exposing tools as a background API, with an autonomous client orchestrating the LLM through scripts, webhooks, or cron. No chat interface is required.
ZoomInfo’s GTM.AI, generally available June 1, 2026, illustrates a related pattern by exposing its graph through MCP as a headless GTM context layer. For a Supabase team, the relevant point is the separation between governed context and the interface consuming it. Claude and a human dashboard can both use the same MCP-exposed metric definitions to answer from the same calculation. MCP makes that shared access practical, but the agreement depends on the definitions behind it.
Pre-modeling metrics so agents and humans share a single set of numbers
Securing an endpoint does not make its numbers correct. At a startup, one engineer may calculate revenue with SUM(revenue) while another uses SUM(amount_captured), producing different Q2 answers that remain unnoticed until an investor asks for audited numbers. Both queries can be properly authorized. The failure is definitional drift. Metric definitions therefore have to precede the endpoints that expose them, even though they sit behind those endpoints in the serving architecture.
Every metric an agent acts on should be calculated ahead of time and stored under a governed, named definition. That prevents the calculation from changing according to whoever, or whatever, queries the database that day. For most B2B SaaS startups, the actionable core includes CAC, LTV, monthly churn, ARR, and gross margin. A North Star Metric identifies the value the product delivers, with other measures explaining movement in that number.
Stage determines which metrics deserve attention first. Early-stage teams should instrument activation and retention before optimizing mature scale metrics, because activation rate and PMF indicators are more actionable at pre-seed than CAC efficiency. The same discipline applies to reconciliation. ARR should reconcile to the billing system, cash to the bank, and product usage to the governed analytical layer. When sales, finance, and an agent cite a metric, their answer should depend on that designated source across interfaces.
Putting the pattern together: the instrumentation architecture from event to endpoint
The implementation begins with a dedicated log sink for structured agent events. Tool calls, decisions, errors, and latency become the audit trail and the input to observability tooling. Supabase’s infrastructure signals add to that trail by showing query pressure, connection use, API performance, and failures. The two records serve different purposes. One explains the agent’s execution, while the other reveals its effect on the systems supporting it.
The analytical layer then calculates pre-modeled metrics from source data and stores them as governed datasets outside the production query path. Parquet provides columnar efficiency, with DuckDB making those datasets queryable. This is where the named metric definitions become serving data. The separation keeps agent-driven analytical scans off the production instance rather than merely granting those scans a read-only connection. Freshness, contextual richness, and consistent definitions remain requirements of this layer.
Named query functions expose the results as MCP tools with typed signatures, read-only access, row-level security, and statement timeouts. Where Postgres serves the governed views, it enforces row-level security at the database layer. OAuth or JWT middleware surrounds every endpoint, credentials remain isolated per agent, and no tool inherits permissions beyond its task. The agent discovers an operation and calls it without generating SQL. A dashboard can use the same definitions, and the agent’s decision loop can run without it.
Paragon distinguishes a production integration from a demonstration through reliability, observability, and per-tenant security. The same distinction governs this architecture. A successful tool call proves that an agent can obtain a result, but production readiness also requires an auditable execution record, bounded access, and a calculation that reconciles to its source.