SaaS Revenue Metrics Every Founder Must Track in Postgres
Define the five metrics that actually matter and compute them directly in your database.

Most SaaS founders track too many metrics and act on too few. The dashboard ends up reporting everything and deciding nothing. Leadership teams sit in front of charts updated in real time and still cannot say, with confidence, what is driving the business or what is quietly threatening it. The data is abundant. The clarity is not.
The cause sits in how the numbers get made, not in how many there are. MRR gets calculated in a spreadsheet by one person, in the billing tool by another, and in a BI layer by a third, and each produces a slightly different figure because each starts from a different definition of what counts. None of the three is lying. Thirty minutes get spent debating whose number is right before anyone gets to debate what to do about it.
More tooling doesn't fix this. Another dashboard on top of three disagreeing sources just adds a fourth voice to the argument. The fix is a single, authoritative definition for each metric, computed once, from one source, every time anyone asks. That authority has to live somewhere, and the strongest place for it to live is the database that already holds the subscription data itself, not a reporting layer bolted on afterward.
Postgres as the analytical home for a SaaS subscription business
Everything the five core metrics need already lives in one place for most Supabase-backed SaaS products: subscription records, customer identifiers, payment events, and the foreign keys that tie them together with real relational integrity. That's not a coincidence of convenience. Supabase builds its entire platform on the premise that Postgres is the single source of truth: Auth, storage, and real-time all read from and enforce policies against the same database, and even edge functions, which may bypass row-level security when they connect with a service-role key, still operate against that same Postgres instance. Subscription data never gets siloed off into a separate system that drifts from what the product actually knows about its customers.
Postgres is equipped for the analytical work this calls for beyond the transactional work it's known for. Normalized tables, foreign keys, SQL views, triggers, materialized views, and window functions that make period-over-period comparisons straightforward are all native to it. None of that requires extracting subscription data, reloading it into a separate warehouse, and reconciling two systems before a founder can answer a question investors will ask in the next board meeting. For a team of five or ten, that extra system is overhead without a return. The schema stays legible as the company grows, too: a database engineer hired in year two, a full-stack developer asked to add a report, or an analyst brought on to dig into cohorts can all read and extend the same tables without learning a second platform.
Analytics vendors will argue that Postgres isn't built for analytical workloads, and at a certain scale that argument holds. The vendor's objection is real at data-warehouse scale. It isn't the condition most founders are actually operating under.
The five metrics that give a complete picture of SaaS revenue health
A founder without a dedicated data team needs five numbers, not fifty: MRR decomposition, Net Revenue Retention, CAC payback period, gross margin, and churn rate. Together, these five answer nearly every question an investor or a board member will ask about whether the business is compounding efficiently or merely getting bigger. The point of narrowing to five isn't to simplify for simplicity's sake. Each of these five can be computed directly from the subscription data already sitting in Postgres, without a second system and without a data team to maintain one.
MRR, and its annualized counterpart ARR, is the baseline from which every other calculation is derived. Churn rate, split into logo churn and revenue churn, tells whether the product is actually holding onto the customers it wins, and the two versions of churn tell different stories that both need to be heard.
These numbers don't all move at the same pace, and the review cadence should reflect that. MRR itself is worth checking monthly. CAC, NRR, gross margin, and payback period move more slowly and belong on a monthly cycle tied to the close of the books.
MRR decomposition in Postgres: separating new, expansion, contraction, and churned revenue
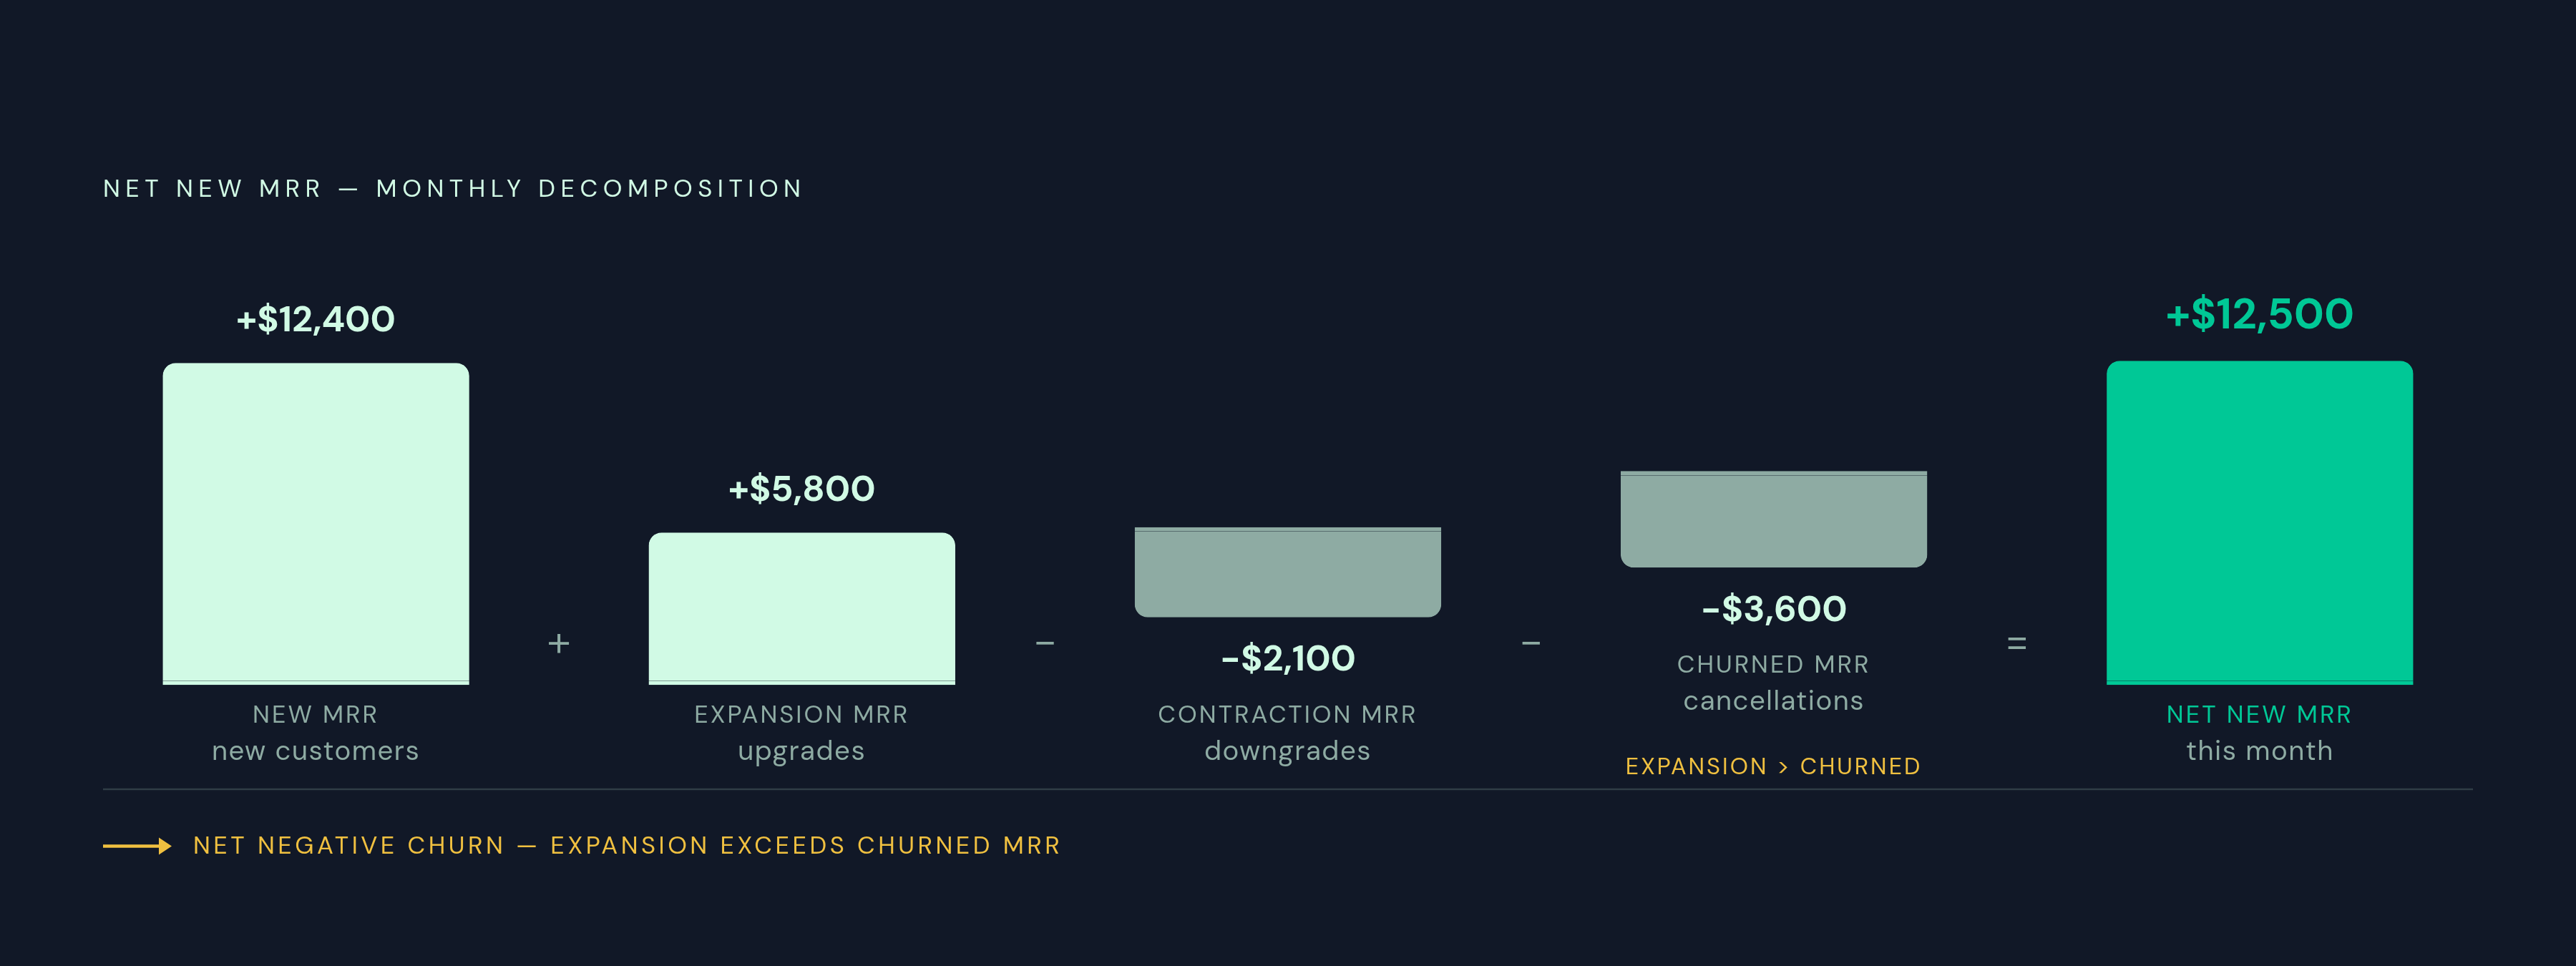
MRR decomposition is the foundation the other four metrics build on, and it comes down to one operation: comparing each subscription's state this period to its state in the prior period. That's a comparison Postgres window functions handle natively, with no external transformation required. Four buckets fall out of that comparison. New MRR comes from customers with no prior subscription. Expansion MRR comes from existing customers whose MRR went up. Contraction MRR comes from existing customers whose MRR went down. Churned MRR comes from customers who cancelled. Net New MRR for the period is New MRR plus Expansion MRR, minus Contraction MRR, minus Churned MRR.
From that shape, a CTE can snapshot each customer's active MRR by month and use LAG() to compare the current month against the prior one:
with monthly_mrr as (
select
customer_id,
date_trunc('month', period_start) as mrr_month,
sum(amount) as mrr
from subscriptions
join prices on prices.id = subscriptions.price_id
where status = 'active'
group by customer_id, date_trunc('month', period_start)
),
mrr_with_prior as (
select
*,
lag(mrr) over (partition by customer_id order by mrr_month) as prior_mrr
from monthly_mrr
)
select
mrr_month,
sum(case when prior_mrr is null then mrr else 0 end) as new_mrr,
sum(case when mrr > prior_mrr then mrr - prior_mrr else 0 end) as expansion_mrr,
sum(case when mrr < prior_mrr and mrr > 0 then prior_mrr - mrr else 0 end) as contraction_mrr,
sum(case when mrr = 0 and prior_mrr > 0 then prior_mrr else 0 end) as churned_mrr
from mrr_with_prior
group by mrr_month
order by mrr_month;
When Expansion MRR exceeds Churned MRR in a given month, the business has achieved net negative churn: the existing customer base is growing in revenue even if not a single new logo comes in the door that month. That's a materially different story than a flat MRR line tells on its own. Two businesses can post the same top-line MRR growth rate while one is decelerating off a high base and the other is accelerating off a low one, and decomposition is the only way to tell which story is actually true.
Net Revenue Retention calculated from the same subscription table
NRR is one additional step on top of the MRR decomposition already built, reusing the same expansion, contraction, and churn buckets computed above. The formula is Starting MRR plus Expansion MRR, minus Contraction MRR, minus Churned MRR, divided by Starting MRR, measured against the same cohort of customers across the period.
Gross Revenue Retention is the more conservative sibling of this calculation, and it sets a floor: Starting MRR minus Contraction minus Churn, divided by Starting MRR, calculated before expansion is added back in. The gap between GRR and NRR is informative in its own right. A business with strong NRR but weak GRR is leaning on expansion revenue to paper over a retention problem that would otherwise show through clearly.
Wrapping the decomposition CTE from the prior section in a second aggregation, grouped by cohort month, turns this into a straightforward ratio:
select
mrr_month,
sum(mrr) as starting_mrr,
sum(expansion_mrr) as expansion,
sum(contraction_mrr) as contraction,
sum(churned_mrr) as churned,
(sum(mrr) + sum(expansion_mrr) - sum(contraction_mrr) - sum(churned_mrr))
/ nullif(sum(mrr), 0) as nrr
from mrr_with_prior
group by mrr_month;
Turning this into a SQL view makes it reusable for any trailing twelve-month window a board asks for, without rebuilding the query each time. NRR above the breakeven point where the existing customer base grows in revenue with zero new acquisition marks that compounding dynamic as what distinguishes the top quartile of SaaS businesses from the rest of the field. It's the single number investors weight most heavily when assessing durability, because it answers the retention question without any dependence on the sales team's future performance.
CAC payback period: pulling acquisition cost and gross margin into one query
CAC payback period answers whether the growth motion a company is running actually pays for itself in a reasonable time frame, and answering it requires joining two domains of data that often live apart: acquisition spend and subscription revenue. Postgres handles that join natively, inside the same database already holding the subscription tables.
CAC itself is total sales and marketing spend in a period, divided by the number of new customers acquired in that period. Spend data frequently lives outside the main Supabase database, tracked in a finance tool or a spreadsheet kept by whoever manages the marketing budget. The practical fix is not an integration project: a simple marketing_spend table, populated manually each month with total spend and channel, is enough to keep the query self-contained and joinable against the new-customer counts the decomposition CTE already produces.
select
ms.spend_month,
ms.total_spend,
count(mm.customer_id) as new_customers,
ms.total_spend / nullif(count(mm.customer_id), 0) as cac
from marketing_spend ms
join monthly_mrr mm
on date_trunc('month', mm.mrr_month) = ms.spend_month
where mm.prior_mrr is null
group by ms.spend_month, ms.total_spend;
The number this produces is only honest if the spend figure is fully loaded. If acquisition source is stored on the customer record, breaking CAC out by channel, organic, paid, referral, is a GROUP BY away and gives a far more actionable read than a single blended number, since it shows which channel is actually earning its spend back.
Gross margin for SaaS and AI SaaS: what belongs in COGS
Gross margin is only as trustworthy as the COGS definition feeding it, and the most common calculation error in SaaS finance is classifying hosting, support, or API costs as operating expenses instead of cost of goods sold. That misclassification inflates margin and misleads anyone reading the number, including investors who price gross margin directly into valuation multiples.
COGS for a SaaS business properly includes hosting and infrastructure costs, the portion of customer support directly tied to delivering the service, and third-party API costs tied to the product itself. It excludes R&D salaries and general G&A, which belong further down the income statement as operating expenses. AI-native SaaS products carry an additional COGS line that traditional SaaS benchmarks were never built to anticipate: inference costs from LLM API calls per customer, which can be large and can swing significantly from one customer to the next depending on usage. A founder running an AI-native product on Supabase needs to track that line explicitly, because it compresses gross margin in ways a traditional per-seat SaaS model doesn't.
The formula is simple once the inputs are right: Gross Margin equals Revenue minus COGS, divided by Revenue, expressed as a percentage. The Postgres pattern for this is a cogs_items table recording monthly cost line items by category, infrastructure, support, API, joined to MRR by period:
select
mm.mrr_month,
sum(mm.mrr) as revenue,
sum(ci.amount) as cogs,
(sum(mm.mrr) - sum(ci.amount)) / nullif(sum(mm.mrr), 0) as gross_margin
from monthly_mrr mm
join cogs_items ci
on date_trunc('month', ci.cost_month) = mm.mrr_month
group by mm.mrr_month;
Gross margin determines how much of each revenue dollar is left to fund sales, marketing, R&D, and G&A, and investors read that difference directly into how they value the company.
Churn rate queries: separating logo churn from revenue churn and reading what each signals
Logo churn and revenue churn are two different queries answering two different questions, and treating them as interchangeable produces the single most common misreading of a SaaS business's health. Logo churn, the count of lost customers divided by customers at the start of the period, measures how many relationships were lost without regard to size. Revenue churn, Churned MRR divided by Starting MRR, measures how much revenue was lost, weighted by account size. A business can lose a large number of small accounts while keeping every large one, and that business will show low revenue churn sitting right alongside high logo churn. Reading only one of the two numbers hides exactly the half of the story the other number tells.
Both queries extend the same decomposition chain already built. Logo churn is a COUNT on subscription status transitions. Revenue churn reuses the Churned MRR bucket already computed in the decomposition CTE, turning it into a ratio rather than a new calculation:
select
mrr_month,
count(*) filter (where status = 'canceled') as churned_logos,
count(*) as starting_logos,
count(*) filter (where status = 'canceled')::numeric
/ nullif(count(*), 0) as logo_churn_rate
from subscriptions
group by mrr_month;
Grouping churn by signup cohort instead of looking at it in aggregate shows whether cancellations cluster in the early months of a customer's lifecycle, an onboarding problem, or spread evenly across tenures, a product-fit problem. Rising contraction MRR is the earliest warning sign of coming revenue churn, since customers tend to downgrade before they cancel outright, and that downgrade appears in the contraction bucket first, giving the team a window to intervene before the account is lost. Failed payment recovery, through retry logic and dunning, reduces involuntary churn without any change to the product itself, and it's worth keeping that category separate in the query so voluntary churn (a customer choosing to leave) doesn't get conflated with involuntary churn (a card that simply failed to charge).
Turning ad-hoc queries into governed, reusable metric definitions with Postgres views and materialized views
A SQL query that gets run on demand, by whoever happens to remember to check it, isn't a metric yet. A metric is a governed definition, one that produces the same number every time, for every stakeholder, computed from the same source. The CTEs built across the previous five sections aren't meant to stay as queries pasted into a notebook before a board meeting. Wrapped into SQL views, they become a single definition of New MRR, Expansion MRR, NRR, or gross margin that every person in the company queries identically, whether that's the founder checking Monday morning or the CFO preparing a board deck.
The definition was settled once, inside the database that already held the data, so the dashboard reports a number nobody has to argue about or reconcile against a second source again.